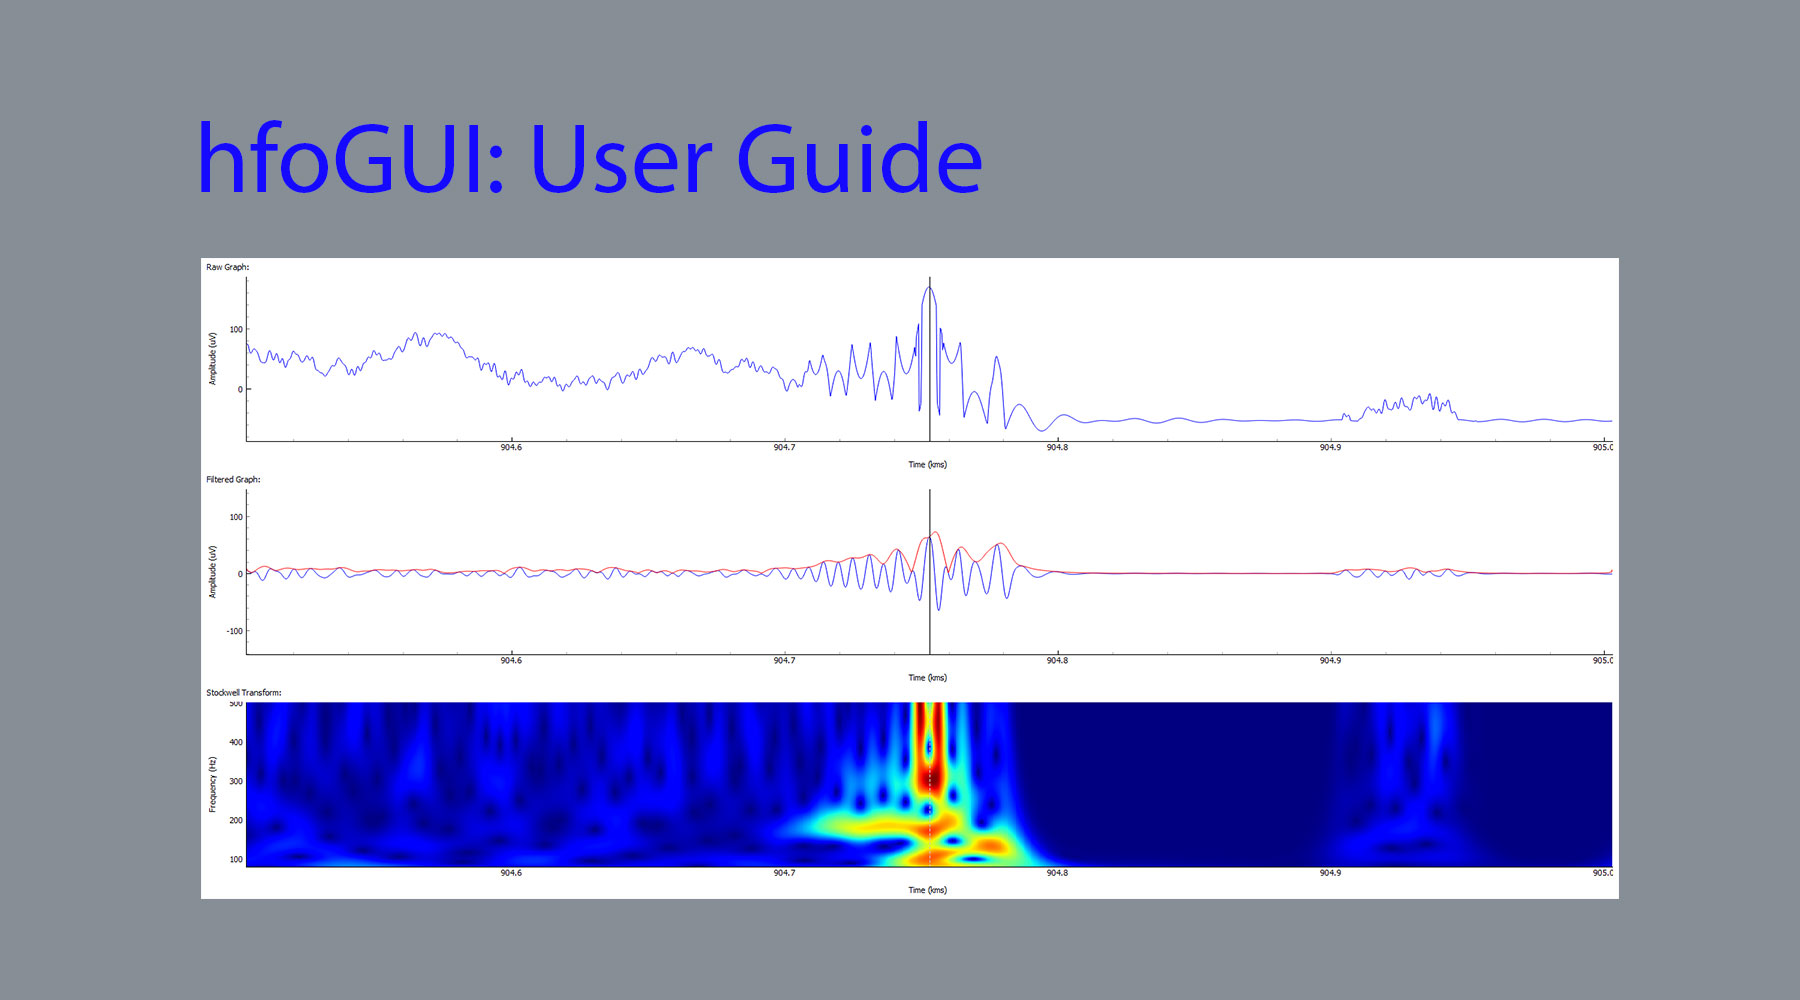
hfoGUI is a Python package that was originally designed so that I could visualize High Frequency Oscillations (HFO's) within the in-vivo electrophysiology data that the lab collected using Axona's dacqUSB1. Although, this project was initially designed for HFO visualization, it has grown to be a more all encompassing visualization tool for the down-sampled LFP data (.EEG/.EGF files).
Requirements
- This is a Python package, so you will need to have Python installed2 before being able to use this software. This code was specifically tested using Python 3.7.
- There is technically no Operating System requirement as hfoGUI utilizes the PyQt5 framework which is cross-platform. However, this code was tested using Windows 10. I assume you will have Windows as Axona's software requires Windows3 (at least as of the time of this post).
Installation
- I have uploaded hfoGUI to PyPi, so you can install using the pip installation method:
python -m pip install hfoGUI - Once the package has been installed, you can launch the GUI using the following command:
python -m hfoGUI
References
- Axona's Company Website: http://www.axona.com
- Python Downloads: https://www.python.org/downloads/
- Axona's Compatible Operating Systems: http://axona.com/support/faq#S1